
Walsh Pure Technicals - Pure Hedge Division
Jon Wiedeman 10/07/2025
If you would like to receive more information on the commodity markets or would like to open an account, please click the link Sign Up Now
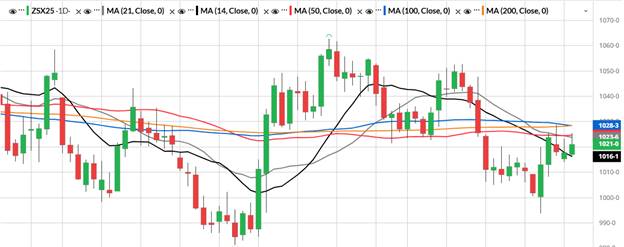
Daily ZSX5:
November beans closed the day higher led by Soybean Oil closing two days in a row higher. Looking at the daily charts for support and resistance will start with support at yesterday’s low which is 1014 followed by 1008 ¼ and last week’s low of 993 ¾. For resistance in Nov beans, we have 1028 ¼ which is both the 100- and 200-day moving average followed by last week’s high of 1028 ¾. (see chart below).
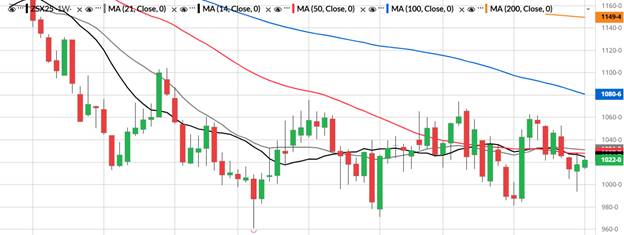
Weekly ZSX5:
Looking at the weekly charts for November beans we have resistance at last week’s high of 1028 ¾ followed by last month’s high of 1053 (see chart below).
Fundamentals:
With the government shut down we are unable to get any fresh data for example exports, commitment of trades, planting progress and this week’s supply and demand report. Everything that we are reading is guesstimates so it’s hard to get a grasp until we start getting updated numbers for grains. Although some guess harvest progress around 40 percent completed in soybeans. Pro Farmer crop consultant Michael Cordonnier left his bean yield unchanged at 52 bpa. We should get some updated news this afternoon about the farm aid package but there are definitely some rumors being thrown out there on what dollars per acres growers can expect, so keep an eye on any updates. Soybeans continue to trade to a discount of South American beans.
Trade Ideas:
Long the 1050-1100 call spread in November beans for 10 cents. Cover the short 11 calls for ½ cent or better.
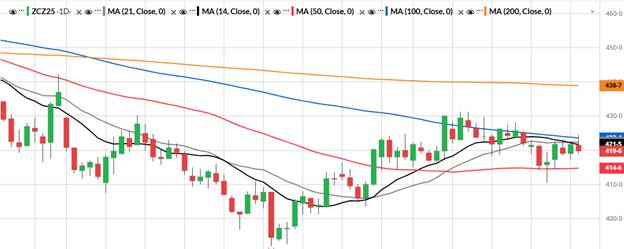
Daily ZCZ5:
December corn closed the day lower following the weakness of wheat. On the daily charts we have support in Dec corn at 417 ¼ which was yesterday's low followed by the 50day moving average of 414 ¾. We have not closed below the 50day moving average since the end of August where it was trading 415 ½. For resistance on the daily charts, we have 423 ½ which is the 100-day moving average followed by last month’s high of 431 ¼. (see chart below).
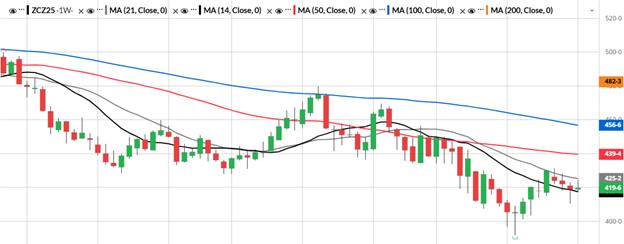
Weekly ZCZ5:
Looking at the weekly charts for December corn we have resistance at 431 ¼ and followed by the 50day at 439 ½. For support I am using 410 ½ followed by 403 ½. (see chart below).
Fundamentals:
With the entire grain complex not getting updated information with the government shut down we have to improvise and go off what analysist are guessing which is harvest around 30 per cent complete which is inline from last year. Pro Farmer crop consultant Michael Cordonnier dropped his 2025 corn yield estimate down 1 bushel to 181 bpa. We will continue to watch how the corn market acts with harvest pressure in full swing over the next few weeks.
Trade Ideas:
Long the December 410-450 call spread for 8½ cents. Place an order to buy back the short 450 calls for ½ cent.
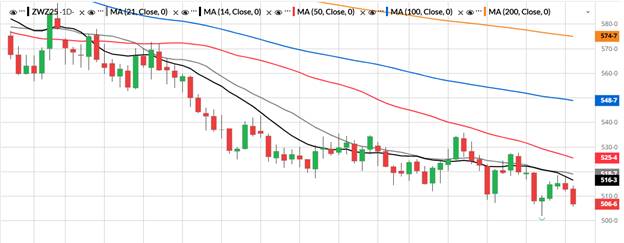
Daily ZWZ5:
December wheat led the grain complex to the downside during today’s trading session. I am still using 502 as support which is the contract low in the December contract then $5. For resistance we have 516 ¼ which is the 14-day moving average then 518 ¾ which is the 21-day moving average followed by 525 ½ which is the 50day. (see chart below).
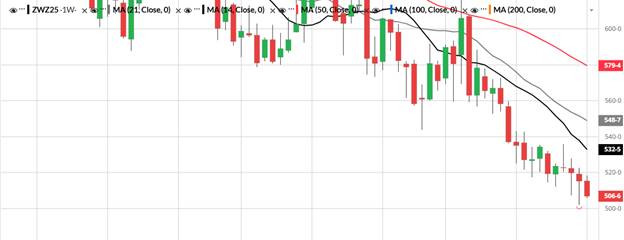
Weekly ZWZ5:
Looking at the weekly charts for December wheat we have support just like the daily charts at 502 and then psychological $5 level. For resistance we have last week’s high of 522 ¼ then the 14-day moving average of 532 ¾. (see chart below).
Fundamentals:
One of the world’s largest wheat exporters Australia is seeing some dry weather issues according to Bloomberg this morning. We are still seeing large supplies of wheat in the world numbers. The market continues to chop around and making lower highs on the weekly charts.
Trade Ideas:
Long the 530 – 570 Dec call spread for 9 cents. Place an order to cover the short 570 calls for ½ cent.
If you would like to receive more information on the commodity markets or would like to open an account, please click the link Sign Up Now

Jon Wiedeman
Pure Hedge Division
Direct: 1 312 957 8108
WALSH TRADING INC.
311 S. Wacker Suite 540
Chicago, Illinois 60606
Walsh Trading, Inc. is registered as a Guaranteed Introducing Broker with the Commodity Futures Trading Commission and an NFA Member.
Futures and options trading involves substantial risk and is not suitable for all investors. Therefore, individuals should carefully consider their financial condition in deciding whether to trade. Option traders should be aware that the exercise of a long option will result in a futures position. The valuation of futures and options may fluctuate, and as a result, clients may lose more than their original investment. The information contained on this site is the opinion of the writer or was obtained from sources cited within the commentary. The impact on market prices due to seasonal or market cycles and current news events may already be reflected in market prices. PAST PERFORMANCE IS NOT NECESSARILY INDICATIVE OF FUTURE RESULTS.
All information, communications, publications, and reports, including this specific material, used and distributed by Walsh Trading, Inc. (“WTI”) shall be construed as a solicitation for entering into a derivatives transaction. WTI does not distribute research reports, employ research analysts, or maintain a research department as defined in CFTC Regulation 1.71.