The Chart’s Flashing a New Warning: META Stock Could Tumble to $500 From Here
/Meta%20Platforms%20Inc_%20by%20PJ%20McDonnell%20via%20Shutterstock.jpg)
Someone forgot to tell Meta Platforms (META) it’s an AI stock. Because while many of its peers are rallying in early October, the social media giant we know for Facebook, Instagram, and WhatsApp, not to mention those cool new goggles and glasses, is pointing in a different direction.
Downward.
META has been one of the best-performing stocks in the world since it went public in 2012, so this is merely a flesh wound to long-term shareholders.
However, when a stock’s price history includes plunging from $385 to nearly $300 lower ($88) in just over a year from 2021 to 2022, and with the memories of its loss of roughly one-third its share price in a matter of weeks earlier this year, risk management is not an idle topic.
I have a two-part rule that guides everything I do as an investor, and always has:
- Any stock can go up any time, for any reason
- The RISK attached to any particular stock is what separates investments I want to make versus those I steer clear of.
META to me appears to be in transition from “not bad” to “be very careful.” Here’s the daily chart, which shows the 20-day moving average starting to tank. That’s the first thing that typically hits my radar, beyond the general shape of the chart itself.
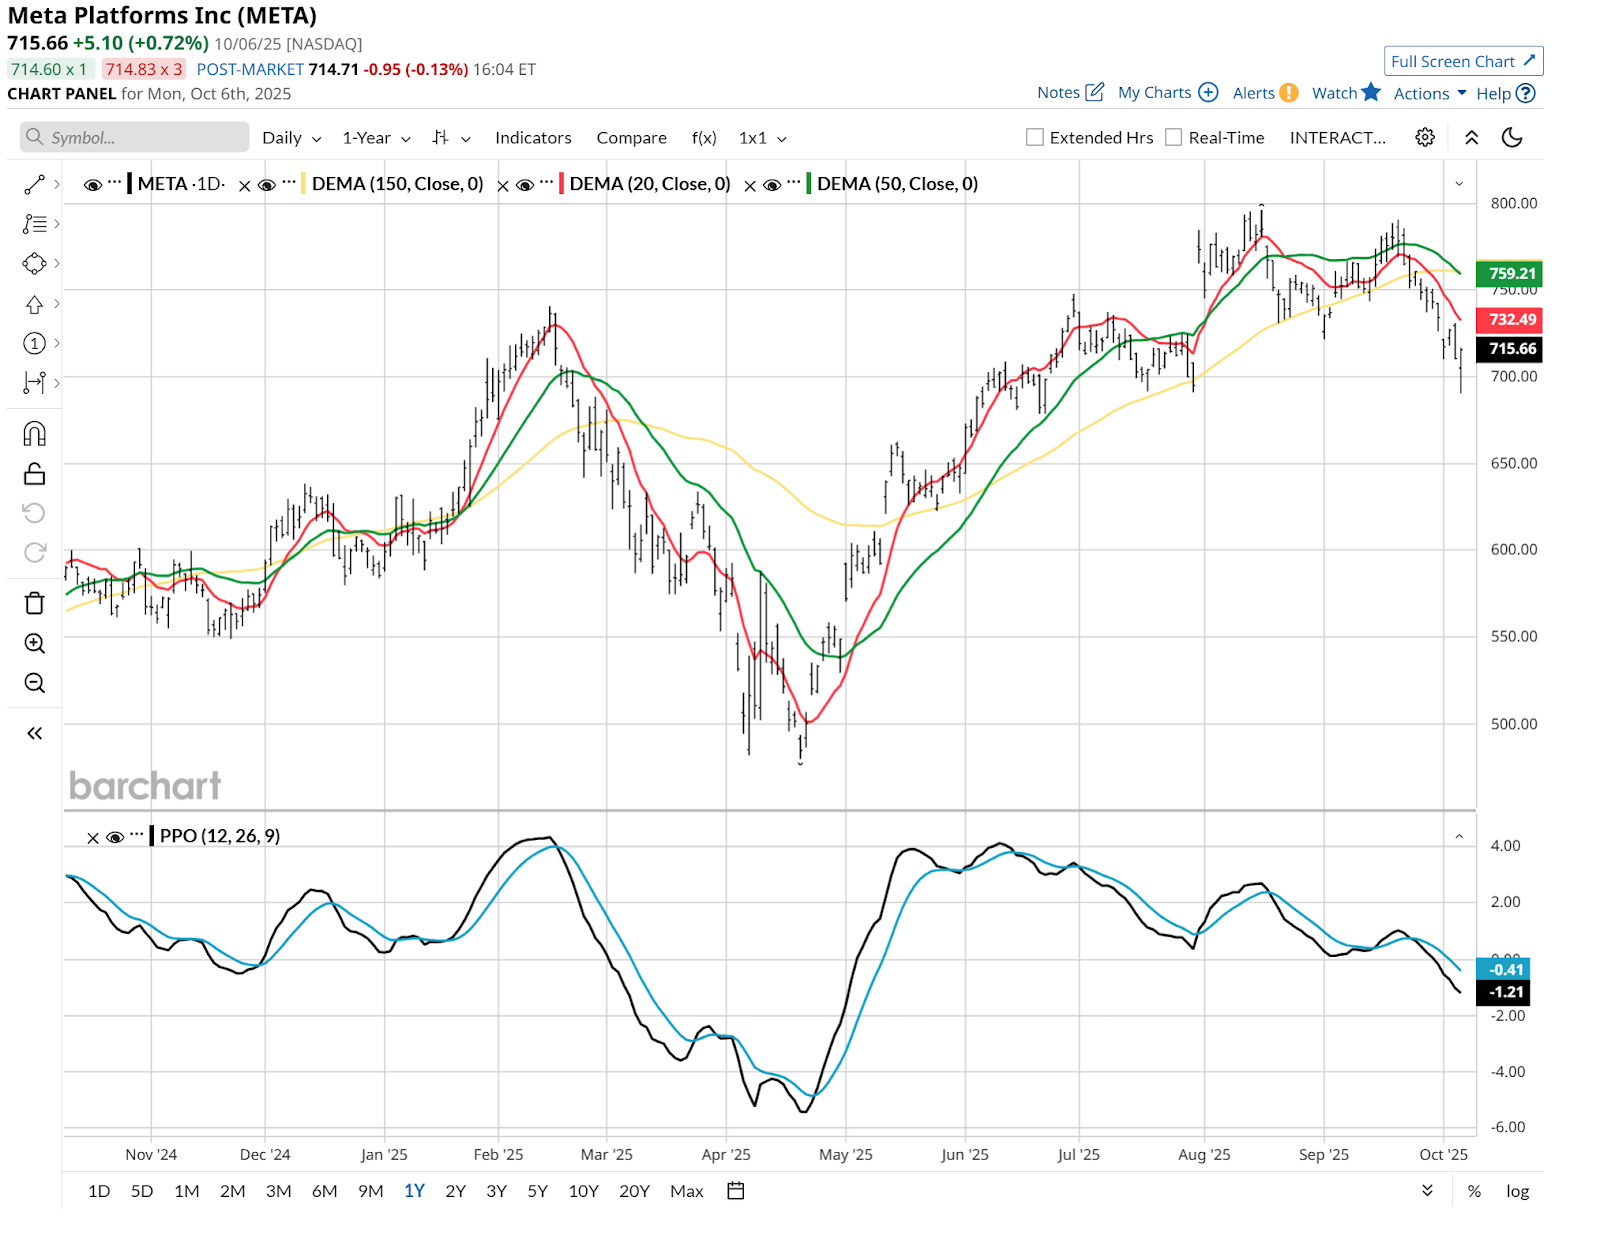
Why META’s Stock Chart Worries Me Right Now
That $700 price area, about 2% below Monday’s close, is a possible landing spot for the stock. Indeed, it traded down to $690 intraday. And there’s a round number at the top of META’s price history too, as it topped out just below $800 in mid-August. But at the margin, I see a new risk of that soft support breaking just below Monday’s low, which could instantly bring that 2025 low into play. That’s way down at $500.
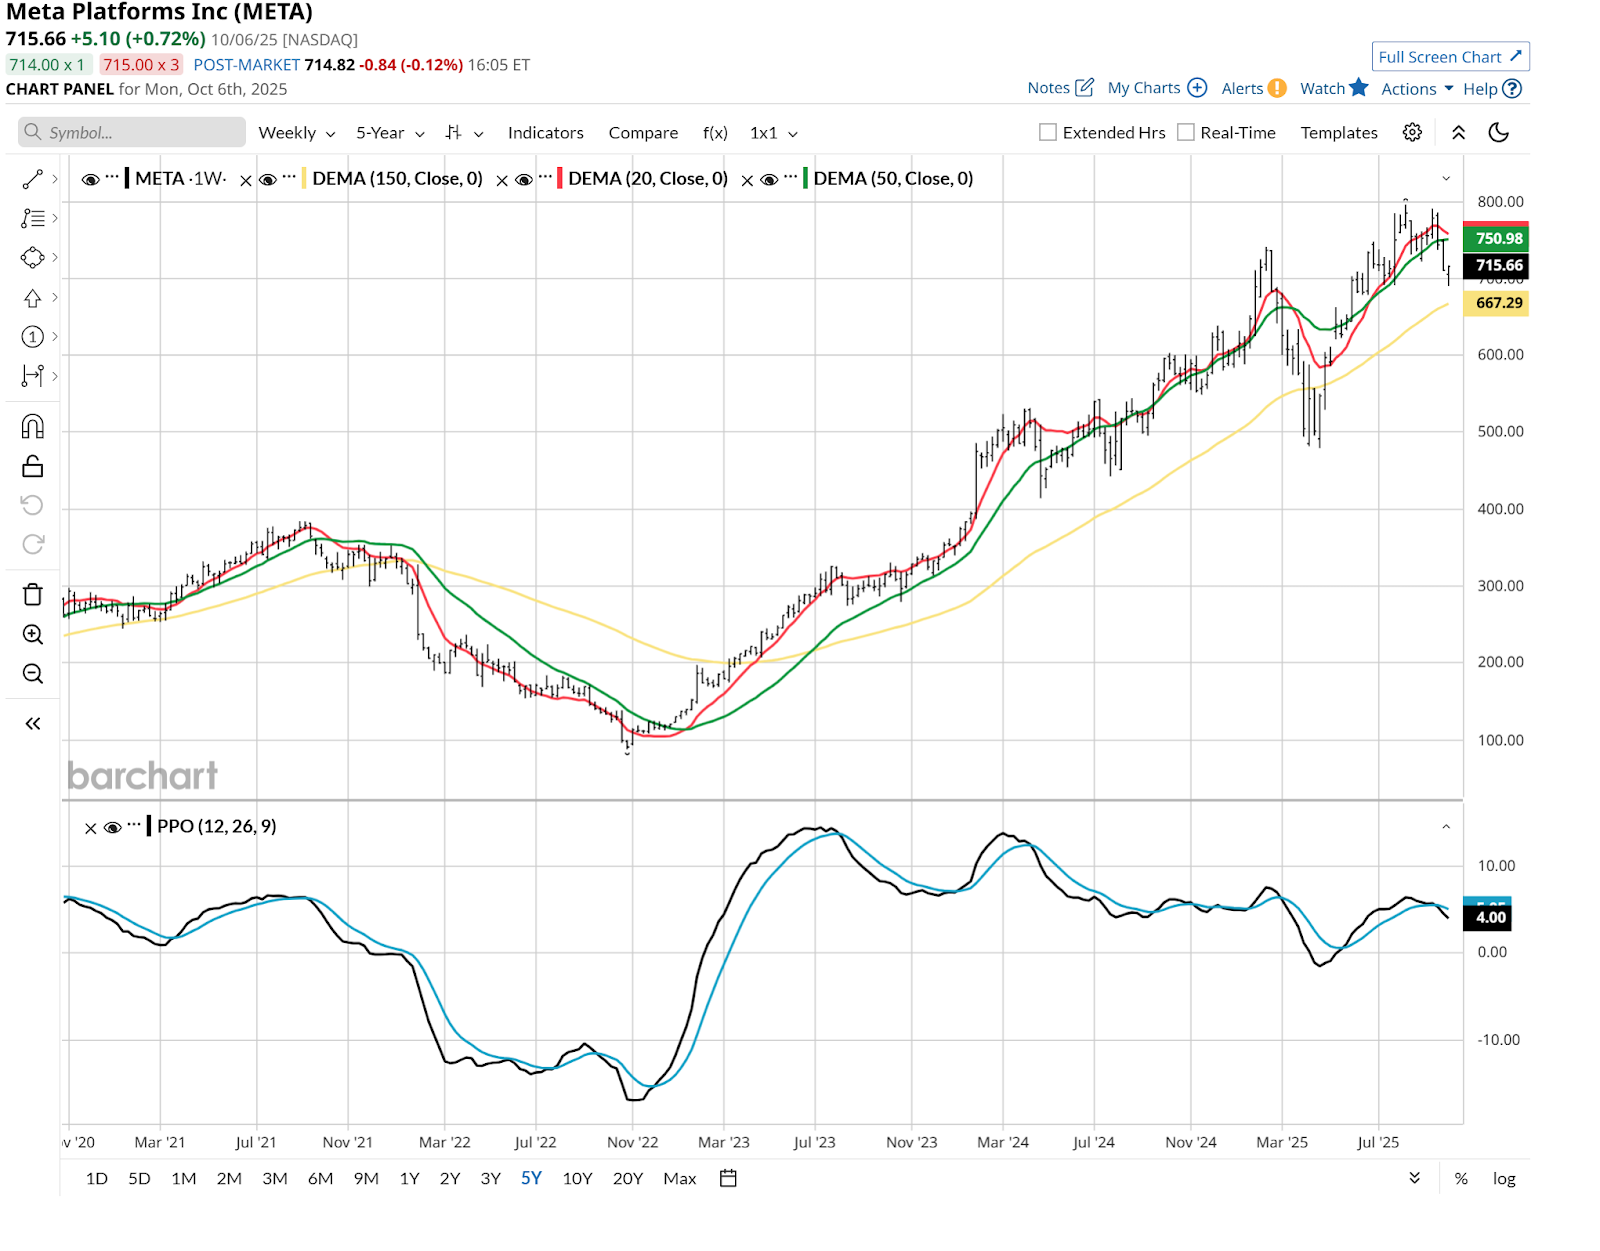
The weekly look below only adds to my concerns with this stock, at least technically. The 20-week moving average (in red) is in the process of rolling over, and the 50-week (green line) is just hanging on. More significantly, that Percentage Price Oscillator (PPO) indicator is tenuous at best. It is hard to deny that there’s selling pressure underway here.
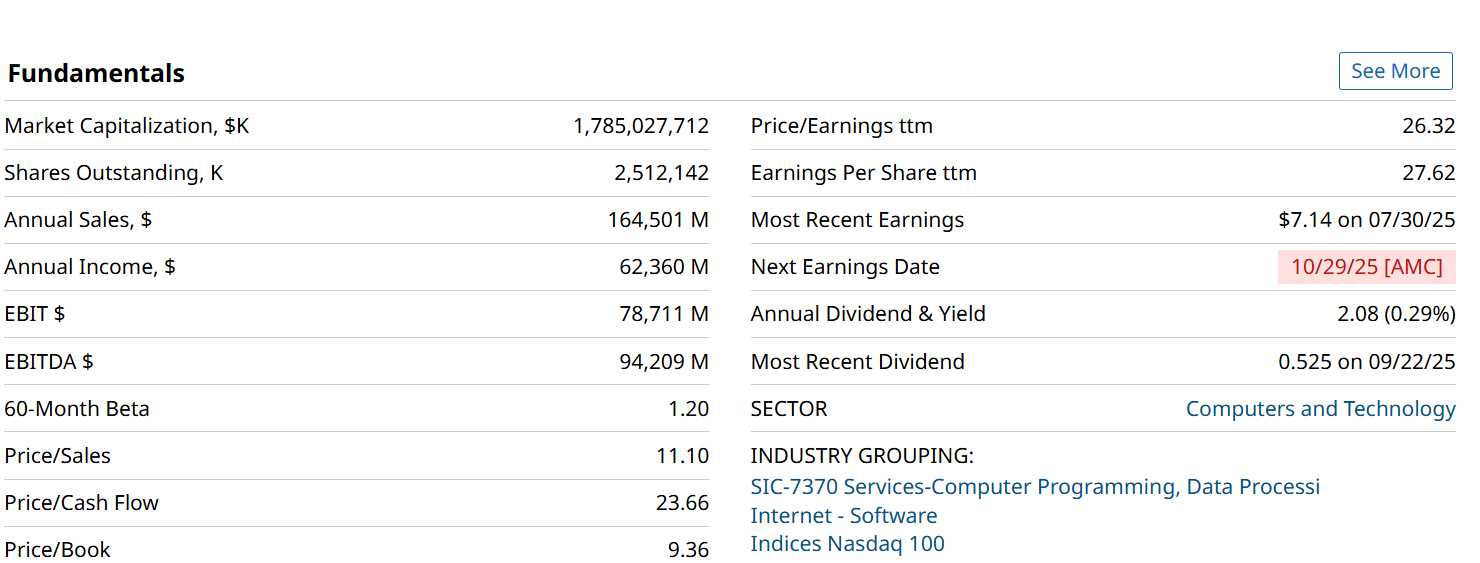
Earnings are about three weeks away, so there’s a lot of time for the stock to fade into that event, before the market gets to react to another fresh quarterly report from Mark Zuckerberg’s company.
META sells at 26x trailing earnings, not outrageous in today’s market. But I can’t say the same about that 11x sales figure.
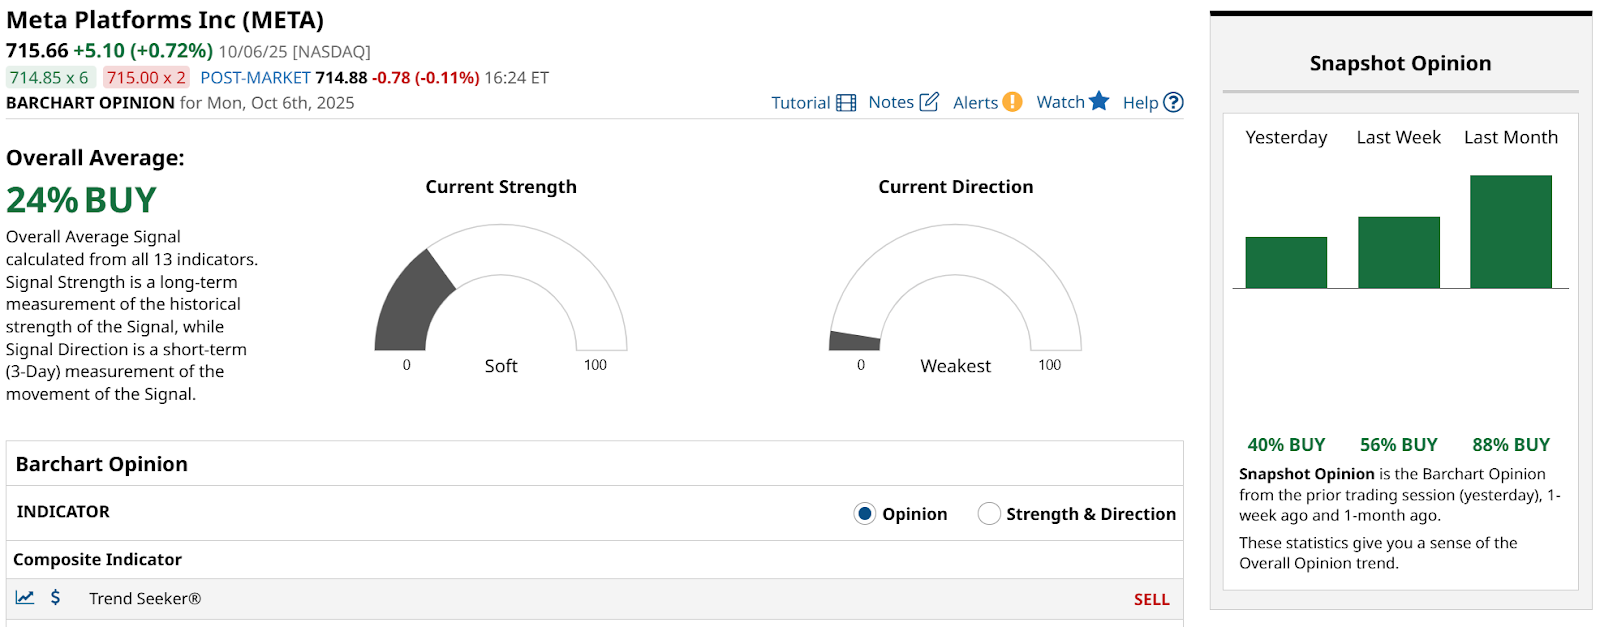
Returning to the technical picture for META, I note that while the stock is a “Buy” using Barchart’s 13-part Barchart Opinion indicator which covers three separate time frames, that 24% mark you see at left in green is lower than it was a week ago. And that latter mark is lower than a month ago. In my experience with this system, that’s not a good sign. It is also why ratings like “buy” and “sell” always need more explanation and context, as you see below.
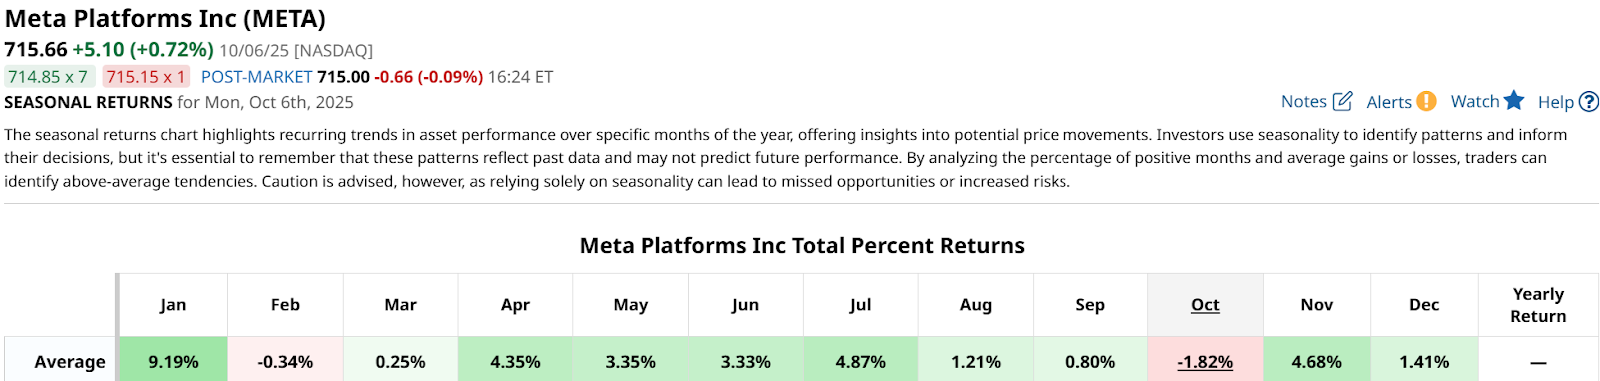
I’m not much of a “seasonality” investor, but I will note that META’s worst month historically is October. And by a noticeable margin.
Wall Street analysts like the stock, even if I don’t. But really, are there many stocks Wall Street doesn’t like after a move like META has had? To say that group are bandwagon-jumpers puts it mildly.
META: More Risk Than Reward
Stocks like META have had a “halo effect” for a long time. They are the quintessential buy-the-dip candidates for so many types of investors, including the powerful algorithms that have such influence on daily trading now. But while you can never count out an iconic stock like this one, I conclude it is more risk than is worth it at this moment.
On the date of publication, Rob Isbitts did not have (either directly or indirectly) positions in any of the securities mentioned in this article. All information and data in this article is solely for informational purposes. For more information please view the Barchart Disclosure Policy here.