Alphabet Posts Lower Free Cash Flow and FCF Margins - Is GOOGL Stock Overvalued?
/Alphabet%20(Google)%20Image%20by%20Piotr%20Swat%20via%20Shutterstock.jpg)
Alphabet Inc. (GOOG, GOOGL) reported higher Q2 revenue on July 23, but lower operating cash flow and significantly reduced free cash flow (FCF). Based on its capital expenditure plans, Alphabet's FCF could decline 10% over the next 12 months (NTM).
As a result, GOOGL stock may be fully valued today. Shorting out-of-the-money (OTM) put options to set a lower buy-in point may be a good play here. This article will delve into this.
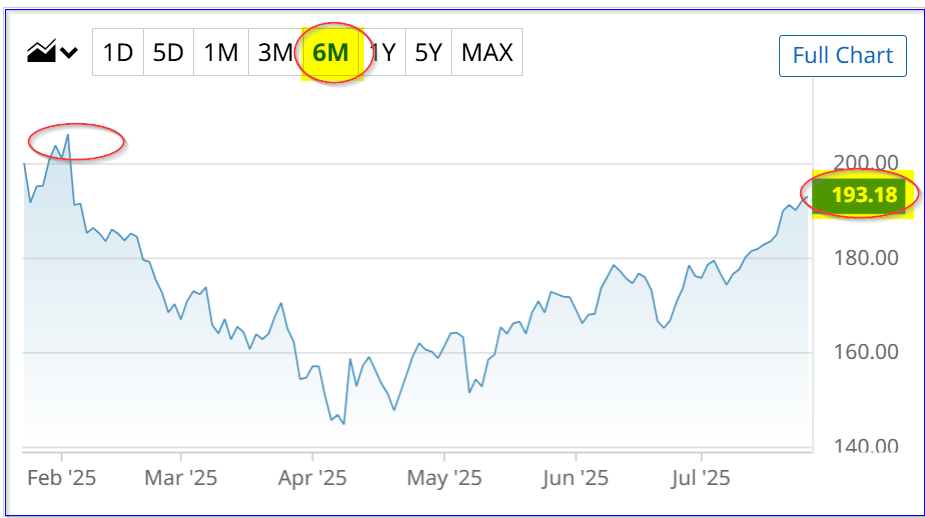
GOOGL closed at $193.18 on Friday, July 25. That is up from its July 23 close of $190.23, and well off its 6-month peak of $206.38 on Feb. 4. It's possible, without a huge increase in the stock's FCF multiple, GOOGL could be worth around 10% less at $174 per share.
Alphabet's AI-Driven Capital Spending Plans
Alphabet's Q2 revenue rose 14% YoY, and its operating income was also 14% higher. Moreover, the operating income margin stayed flat at 32% for both periods.
But that is all before the company's cash flows and, more importantly, its capital expenditure (capex) activities.
The table below from its Q1 and Q2 earnings releases shows that operating cash flow margins fell YoY, and its capex spending exploded.
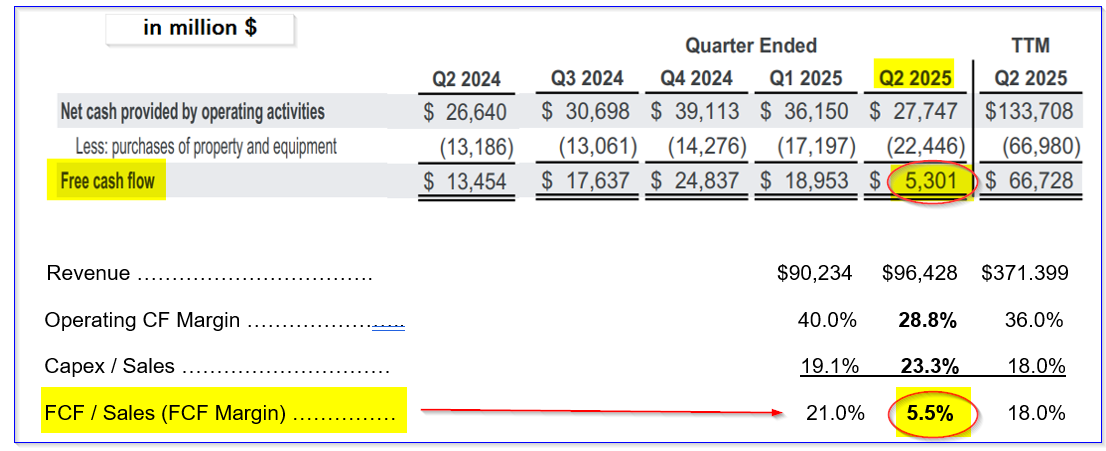
As a result, this table shows that Alphabet's FCF margin imploded to just 5.5% of sales, down from 21% last quarter and 18% over the last year. It's due to capex spending, which is now 40% of sales and 80% of operating cash flow.
If this keeps up over the next year, Alphabet's valuation could falter. In fact, Alphabet's CEO, Sundar Pichai, said on the first page of the Q2 earnings release, Alphabet will spend $85 billion this year on capex, all driven by its AI-driven activities.
Let's look at that. The table above shows that capex so far this year is $39.943 billion. That leaves $45.057 billion over the next 2 quarters, or $22.5 billion on average (about equal to Q2).
That implies that over the next 12 months (NTM), capex will be $90 billion (i.e., $22.5 x 4). Let's use that to forecast NTM FCF.
Forecasting NTM FCF
Analysts project sales this year will be $393.38 billion and next year $436.94 billion. That puts its next 12 months (NTM) sales forecast at $415.16 billion.
So, if we use its Q2 operating cash flow (OCF) margin of 28.8% and assume it will last over the NTM period:
$415.16b x 0.288 = $119.57 NTM OCF
In other words, OCF could fall from $133.7 billion over the trailing 12 months (TTM) - see the table above - to just $120 billion. That's a 10.2% decline. So, just to be conservative, and to improve the outlook, let's assume the margin stays the same (36%) as the TTM figure above:
$415.15b x 0.36 = $149.6 billion OCF
Next, we can deduct the $90 billion in run-rate capex spending that the CEO implied in his statement that 2025 capex will be $85 billion in 2025:
$150b OCF - $90b = $60 billion FCF
But that is still -10% below the $66.728 billion Alphabet generated in the TTM period (see the table above). In other words, the outlook is not good for Alphabet's FCF rising.
This could dramatically affect the stock over the next year.
Setting a FCF-Based Price Target for GOOGL Stock
One way to value a stock using its FCF forecast is to use a FCF yield metric. This assumes that 100% of the FCF is paid out to investors. What will the dividend yield be?
For example, given the market cap today of $2.341 trillion from Yahoo! Finance, its TTM FCF represents 2.85% of its market value:
$66.728 billion TTM FCF / $2,341 billion mkt cap = 0.0285
This is also the same as multiplying FCF by 35x (i.e., 1/0.0285 = 35.1) So, using this FCF yield metric, and applying to the $60 billion forecast for FCF over the next 12 months:
$60.00b x 35.1 = $2,106 billion est. mkt cap
That is still 10% below today's market cap of $2,341 billion. In other words, GOOGL stock's price target is 10% lower than today, or $173.86:
$193.18 x (1-.10) = $193.18 x 0.90 = $173.86 price target
The point is that GOOGL stock may be overvalued. The only way this might turn around is if its OCF margin rises over 36% (even though it was just 28.8% in Q2) and/or the market gives the stock a higher multiple than 35x FCF.
Therefore, it might make sense to set a lower buy-in price by selling short out-of-the-money (OTM) put options. That way, an investor can get paid waiting for GOOGL stock to fall.
Shorting OTM Puts
For example, look at the Aug. 29 expiration period. That is just over one month from now. It shows that the $175.00 strike price put option, about 9.4% lower than today's price, has a midpoint premium of $1.23 per put contract.
That means a short-seller of these puts can make a yield of 0.70% (i.e. $1.23/$175.00). But note that there is just a 13% chance of this occurring (i.e., the delta ratio is -0.1294).
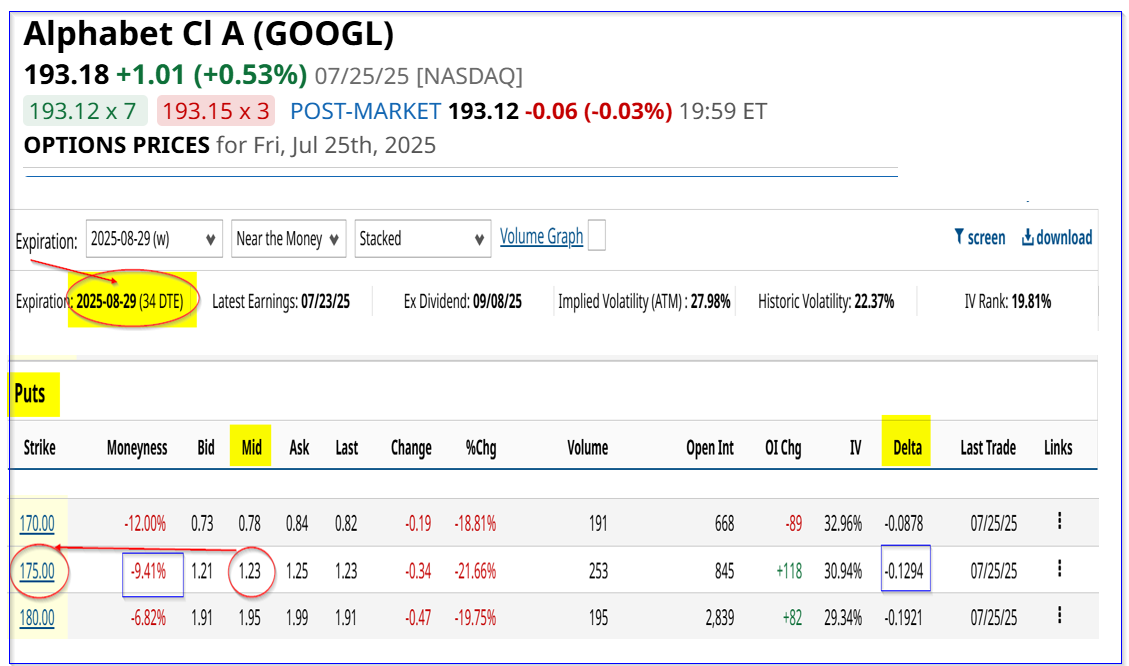
The point is that if GOOGL stock falls to $175.00, the breakeven point for the assigned investor's account is $173.77 (i.e., $175.00-$1.23).
That is just below our breakeven point for the stock $173.86 - see above). If the investor is able to repeat this over the next 3 months until the next quarterly release, the expected return is +2.1% (i.e., 0.70% x 3).
But at least investors in GOOGL stock can make extra income here, shorting puts if they already own shares. The bottom line is that if GOOGL stock falters one way to play it is to sell short OTM puts every month.
On the date of publication, Mark R. Hake, CFA did not have (either directly or indirectly) positions in any of the securities mentioned in this article. All information and data in this article is solely for informational purposes. For more information please view the Barchart Disclosure Policy here.